RF Spectrum & Waterfall
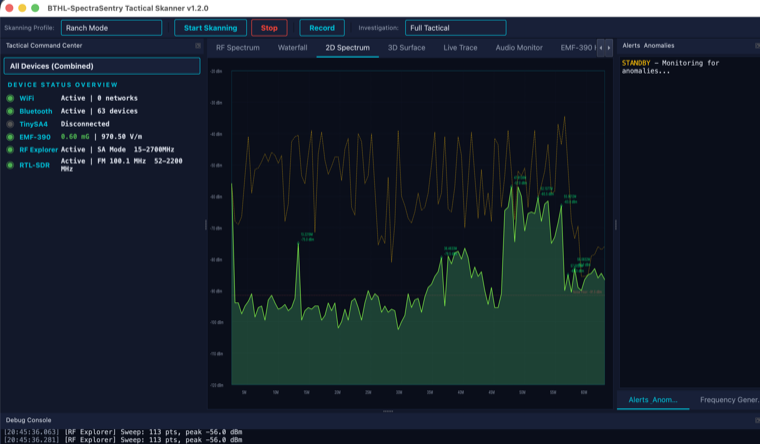
An AirSpy/SDR#-style stacked view — a live 2D spectrum directly above a frequency-aligned waterfall — the default landing display for real RF analysis.
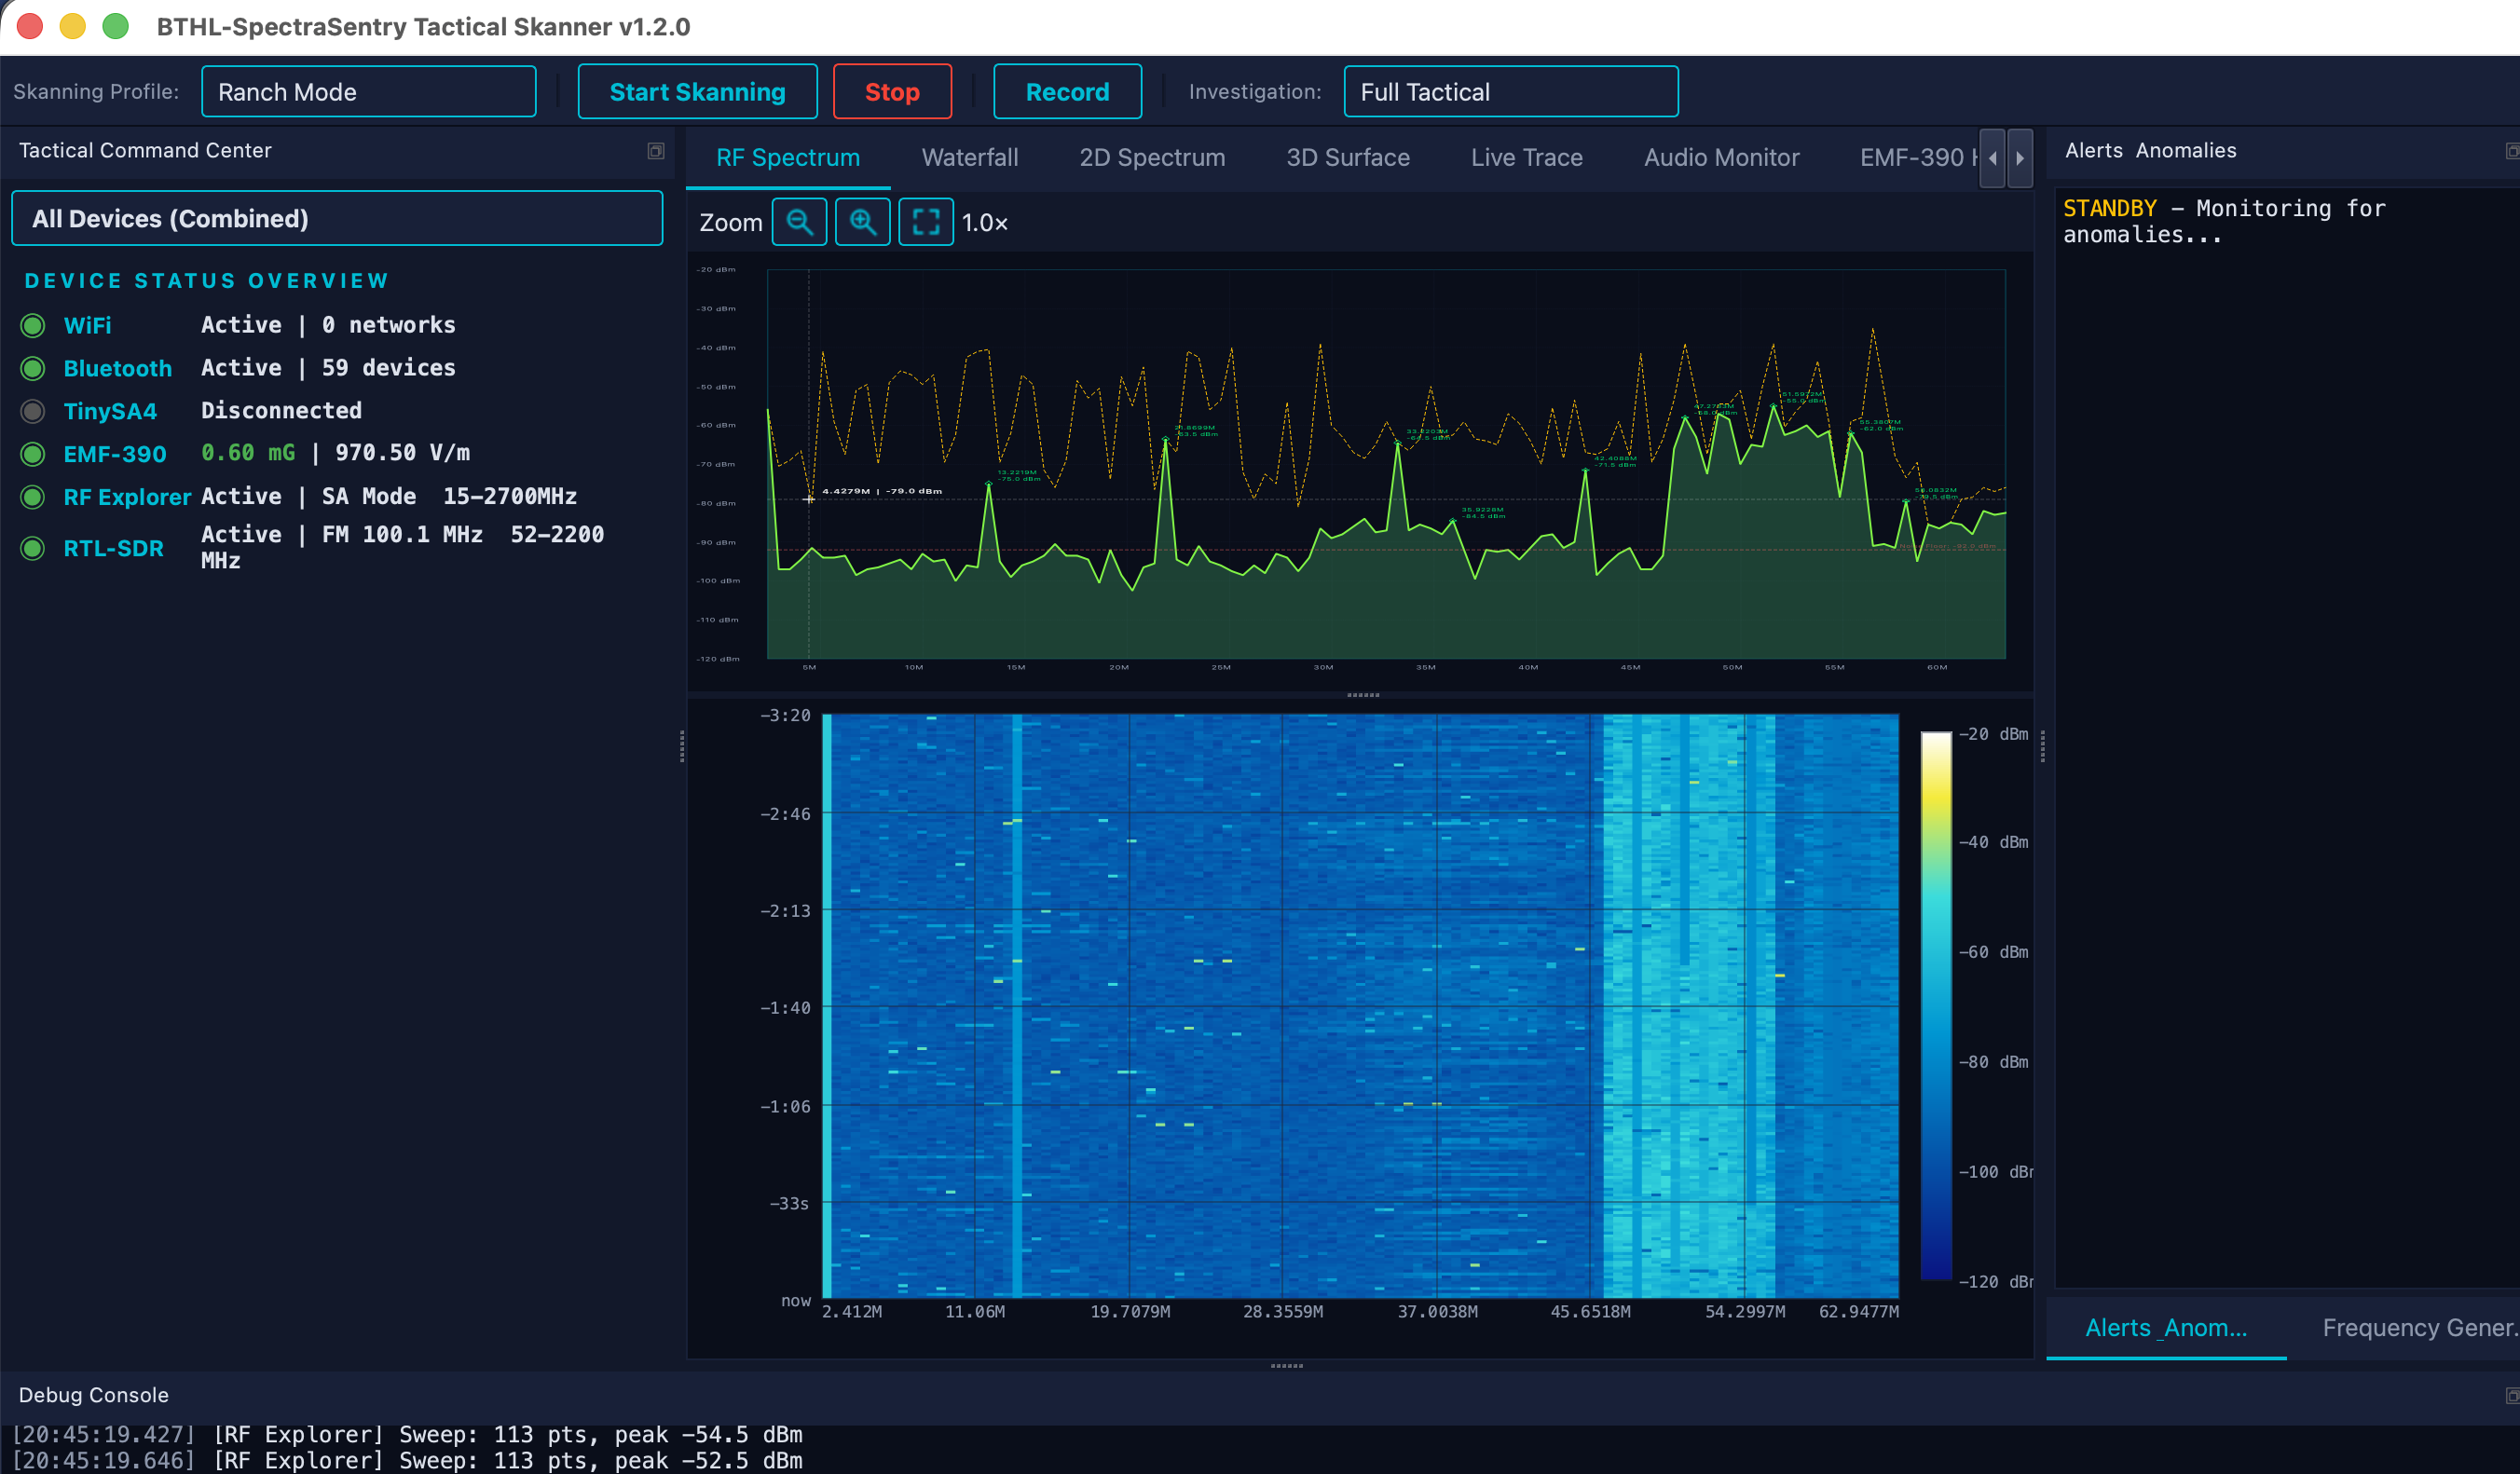
The RF Spectrum tab shows a 2D amplitude trace stacked over a scrolling waterfall spectrogram that shares the same frequency axis, so a signal lines up vertically between the two. Sweep data comes from a connected analyzer (TinySA4, RF Explorer) or the RTL-SDR. The 2D trace supports live, max-hold, average and reference traces with peak callouts; the waterfall renders at up to 60 fps. Standalone 3D-surface and live-trace displays share the same data, and any tab can be popped out to its own window for multi-monitor work.
Surveying the RF environment of a site (what is transmitting, and where in the band).
Watching a specific frequency or span for new or anomalous signals over time.
Lining up a signal’s instantaneous shape (2D) with its history (waterfall).
Documenting findings — export the trace to SVG for reports.
- Connect a sweep device. Plug in a TinySA4, RF Explorer, or Nooelec RTL-SDR. It appears in the device panel.
- Start Skanning. Press the Start button (or F5). The 2D trace and waterfall populate with live RF.
- Pick a color map. Open the waterfall gear to switch maps (airspy, intensity/radar, inferno, viridis, ghost-green, grayscale) and set history depth.
- Zoom in on weak signals. Scroll the wheel or drag-select over the waterfall; the spectrum stays frequency-locked. Use +/−/Fit to magnify telemetry compressed across the span.
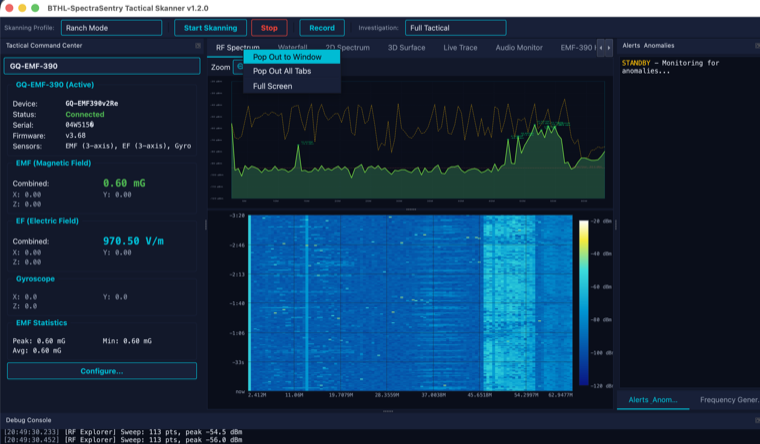
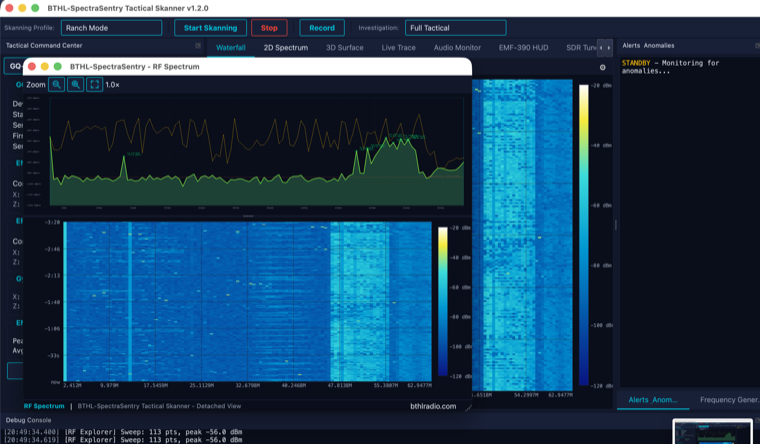
- Pop out. Right-click the tab → Pop Out to Window for a dedicated/secondary-monitor view.
| Color maps | airspy (default) · intensity/radar · inferno · viridis · ghost-green · grayscale |
| Traces | Live, max-hold, average, reference · peak callouts · noise-floor line |
| Waterfall | Up to 60 fps · configurable history depth · left/right stream direction |
| Devices | TinySA4 (100 kHz–960 MHz) · RF Explorer (15 MHz–2.7 GHz) · RTL-SDR (52–2200 MHz) |
| Export | SVG vector export · detachable pop-out windows · HiDPI |