3D Surface & Live Trace
Two more ways to look at the same real sweep data — an orbitable 3D spectral surface and an oscilloscope-style live trace.
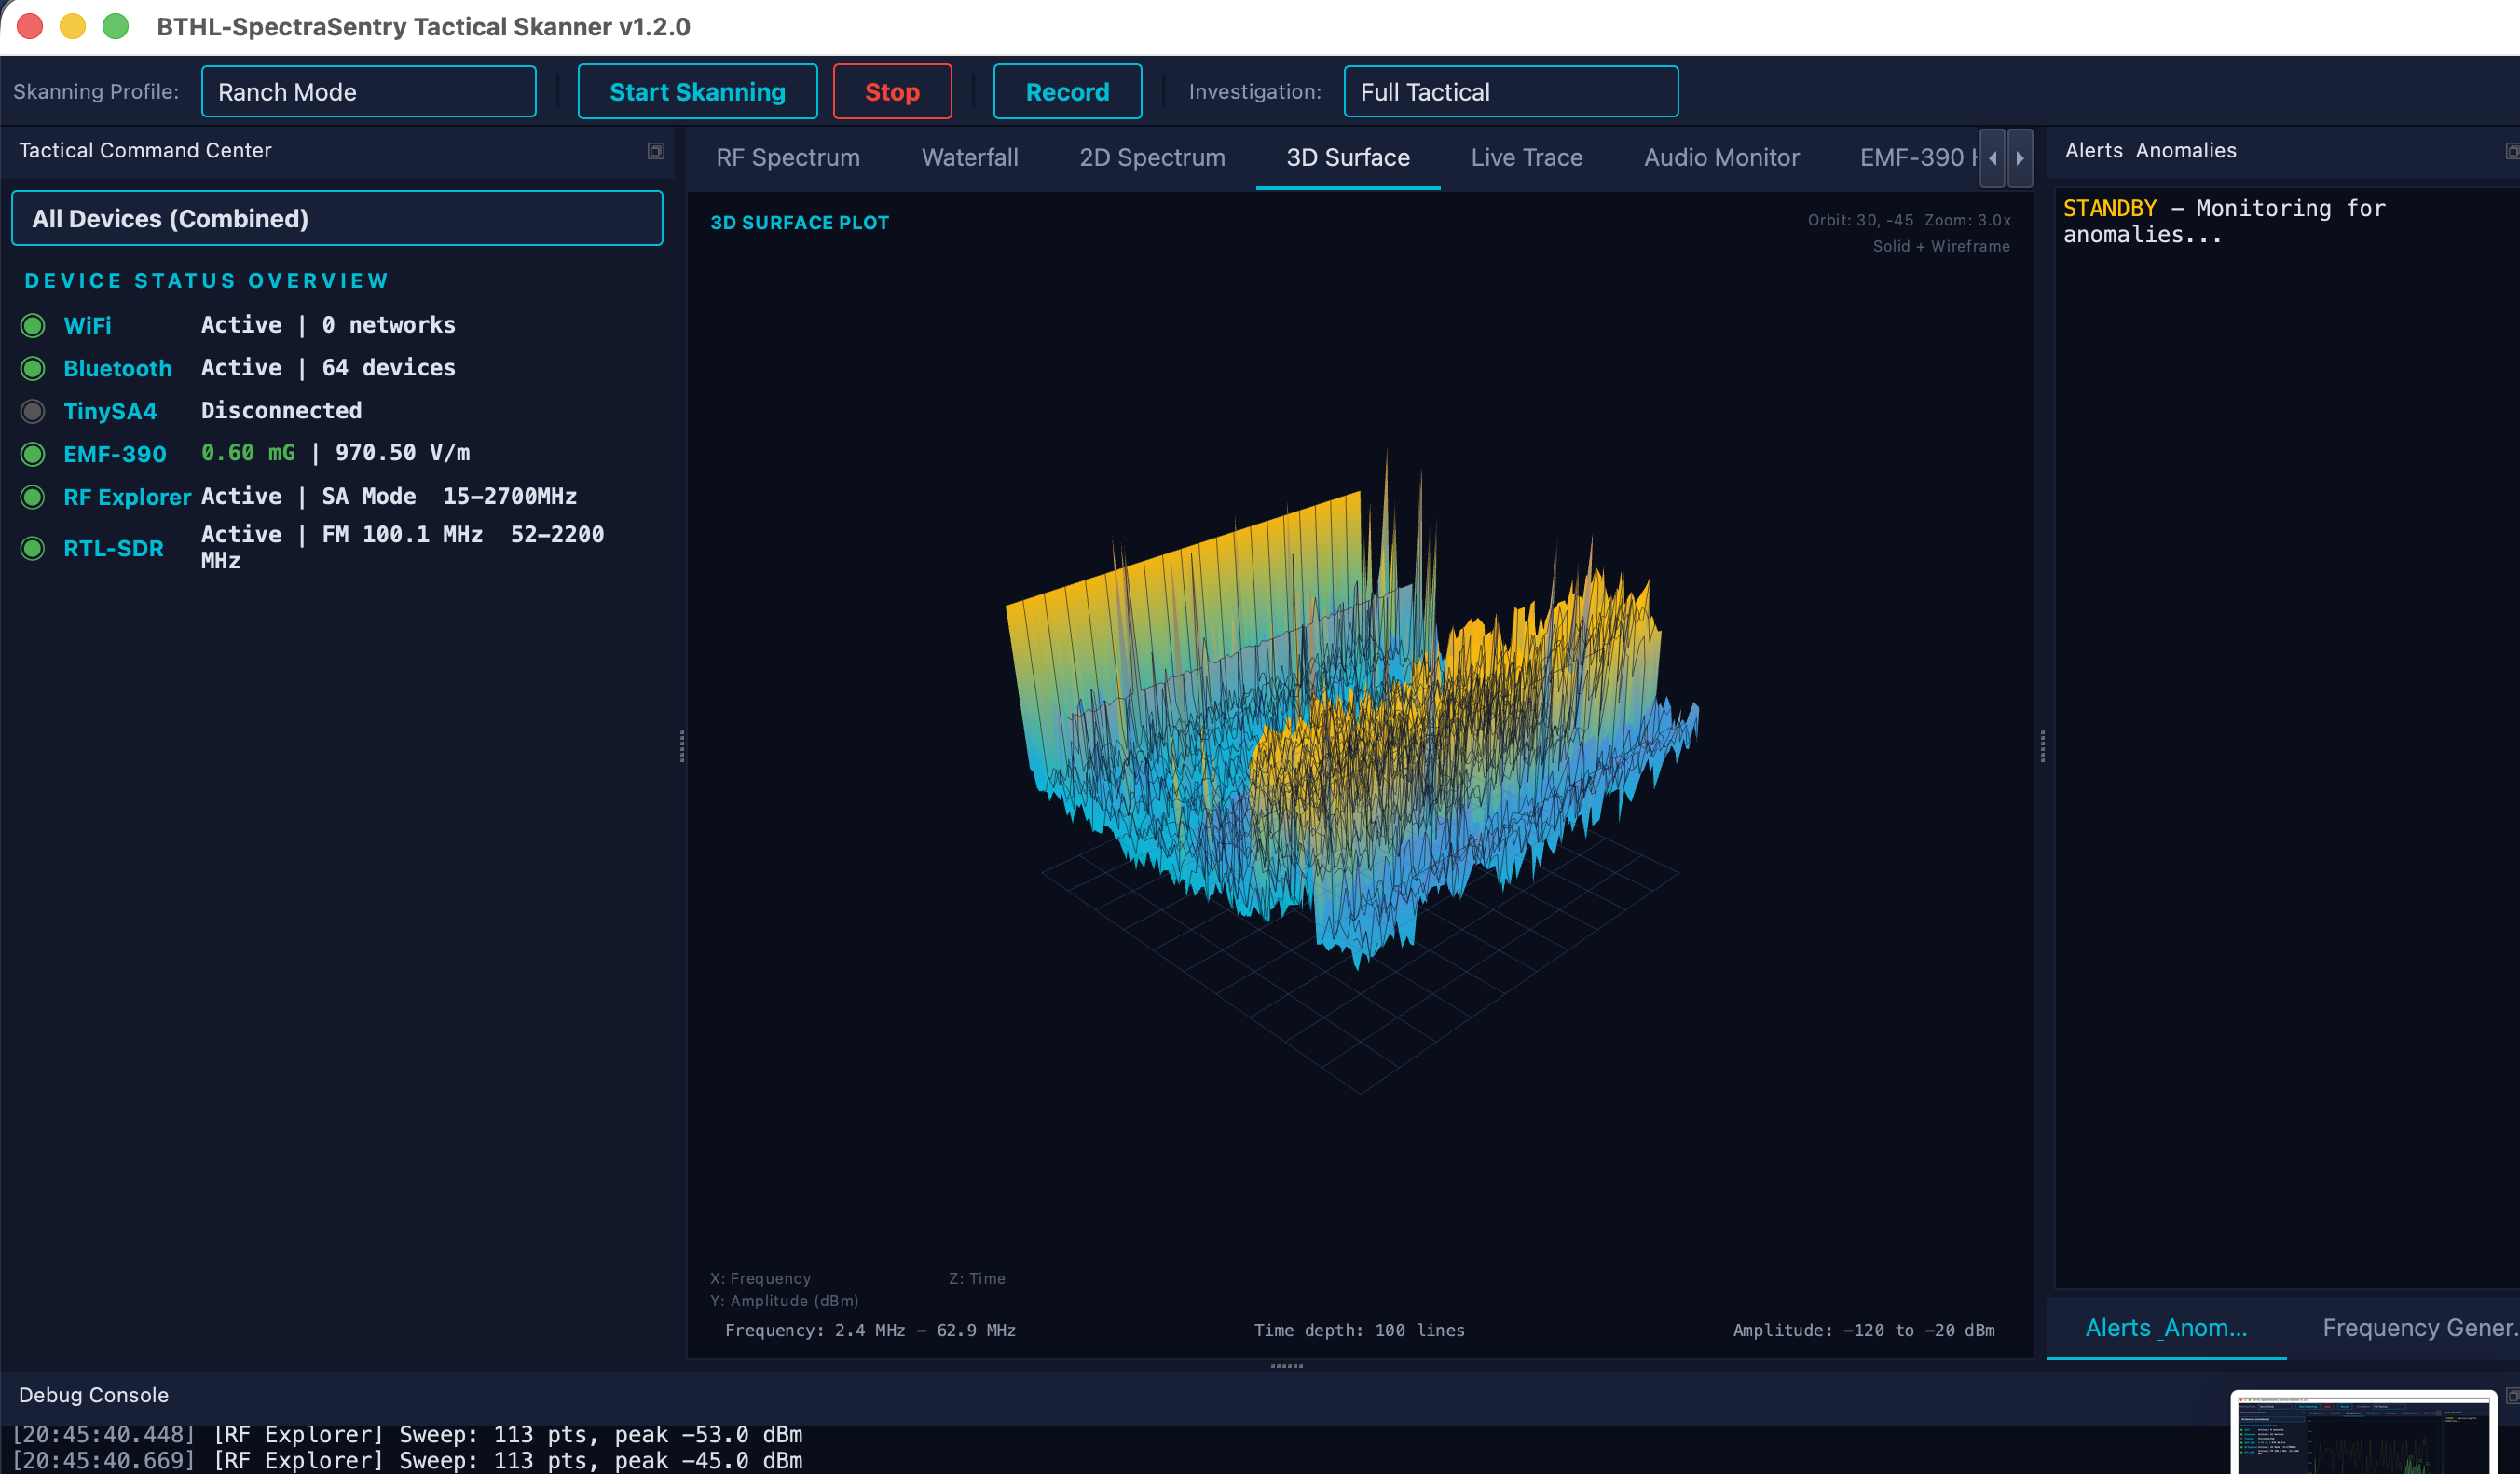
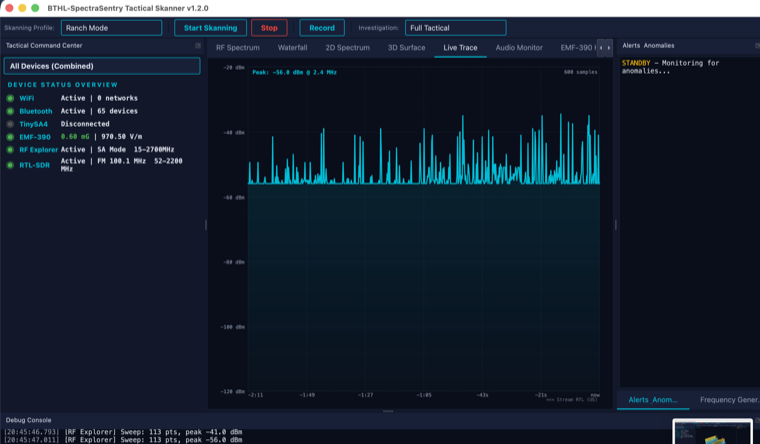
The 3D Surface plots spectrum history as an OpenGL mesh: frequency on one axis, time receding into the scene, and amplitude as height and color, with an optional wireframe overlay. Orbit with the mouse and scroll to zoom the camera. The Live Trace is an oscilloscope-style view of the most recent sweep with selectable 1×–64× magnification, useful for watching a single signal’s envelope in detail. Both are fed by the same real device sweeps as the RF Spectrum tab, and both show a “connect a supported device” message until data arrives — never synthetic peaks.
Seeing how a band’s activity evolves over time as a 3D landscape.
Spotting intermittent or drifting signals in the time dimension.
Zooming into a single signal’s shape with the magnified live trace.
- Connect a sweep device. TinySA4, RF Explorer, or RTL-SDR, then Start Skanning.
- Orbit the 3D surface. Drag to rotate, scroll to zoom the camera; toggle the wireframe overlay.
- Magnify the live trace. Choose 1×–64× to zero in on a signal’s envelope.
| 3D Surface | OpenGL mesh (frequency × time × amplitude) · wireframe overlay · orbit + zoom camera |
| Live Trace | Oscilloscope view of the latest sweep · 1×–64× magnification |
| Data | Same real sweeps as RF Spectrum — no synthetic data |